Resources for the Koerner Library Session for Microsoft Excel®
Overview
This session is for people who are using Microsoft Excel® on a regular basis and who want to use the software as a tool to get things done. Some of the most useful features are not easy to find so we will uncover the mindset behind the user interface to make things discoverable.
The afternoon session will be more specifically for people who manipulate large bodies of data (thousands, and tens of thousands of rows of data).
Course Description
We will:
- Do a review of the basics including the fluent user interface.
- Learn tricks to speed copy/paste operations with Autofill, Format Painter, and other quick ways to boost your productivity with Excel.
- Explore functions in terms of how they work, and focus on certain functions that are relevant to your work.
- Learn to make it easy connect data from one place to another using lookups.
- Work with Tables and PivotTables
Duration: 6.0 hours
ObjectivesBy the end of this session you will be able to
|
Prerequisites
Some prior experience with Excel is strongly recommended. You don’t have to have been designing complex workbooks, but you it would be very helpful if you have ben using Excel for data entry and creating simple worksheets.
Printed Material
You will have a workbook for reference and to add your own notes.
Computer Equipment
The sessions are conducted in a computer lab, and you will have a computer provided for your use.
Sample Files
We will use these sample files during our session. These will be available after the session.
Sample Files (right click, open in new window).
Click on any file to preview it in Excel on the Web, but if you want to work with it, use the download button to copy it to your local hard drive before attempting work with the file.
Or
Instructional Methods
- Hands-on labs
- Discussion
- Lecture
Course Materials
- Web site
- Course notes
- Printed copies of on-screen lecture notes available on request during lectures
No Recording or Pictures in the Lab
Please note: Taking pictures or video during the course sessions is not permitted. All the course materials and lecture notes are available in physical form and on the web.
Sample Files
Click on any file to preview it in Excel on the Web, but if you want to work with it, use the download button to copy it to your local hard drive before attempting work with the file.
Or
Reflection
How are we doing?

See the last page of your notes: Things I really want to remember.
Backup Support Site
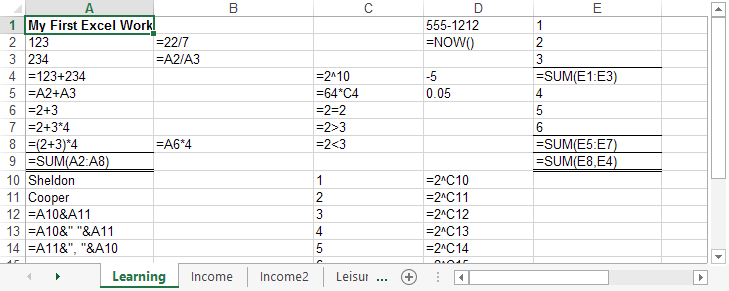
Warm Up Basic Skills
What you saw when it was done
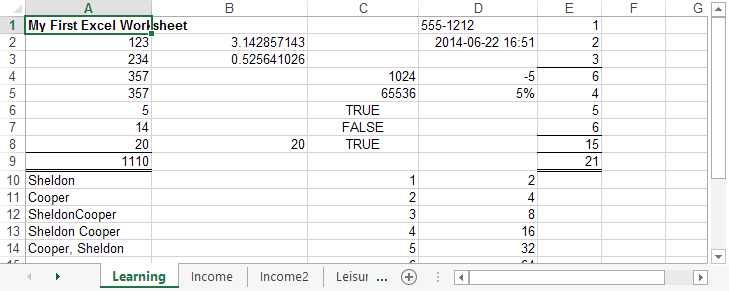
What you typed to make it happen
Quick Access Toolbar
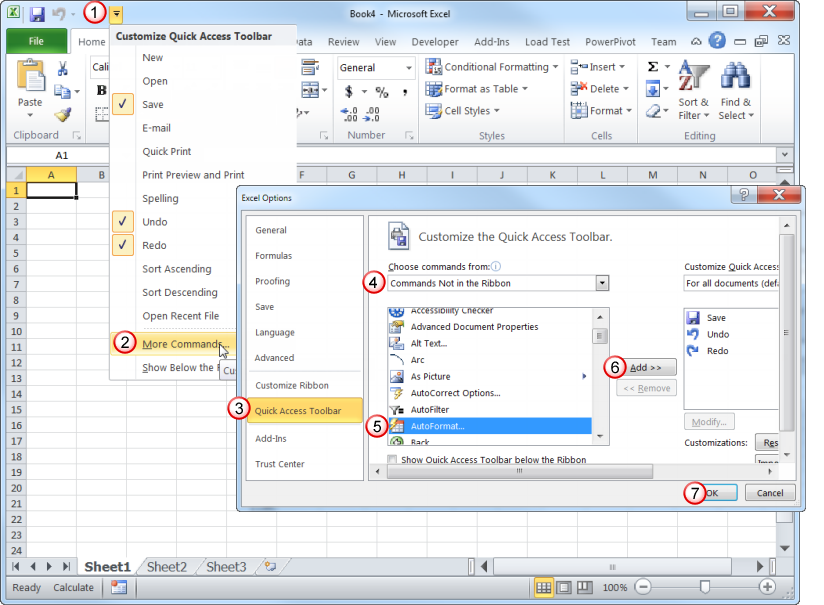
Customize the Quick Access Toolbar
Overview
Decision Support Worksheet
- Design considerations
- Formulas
- Relative and Absolute cell addresses
- Functions: Sum, Max, If
- Conditional Formatting
Discussion

Weighting

Formulas

G13: =G12/MAX($G$12:$I$12)
Copy / Paste

Percentages
G13:
=G12/MAX($G$12:$I$12)
IF
Version 1 “Winner”
G14:
=IF(G13=100%,"Winner","")
Winner / Loser

=IF(G13=100%,"Winner",IF(G13=MIN($G$13:$I$13),"Loser",""))
Conditional

Copy / Paste 2
IF
Version 1 “Winner”
=IF(G13=100%,"Winner","")
Version 2 (Winners and Losers)
=IF(G13=100%,"Winner",IF(G13=MIN($G$13:$I$13),"Loser",""))
Rank
=RANK(G13,$G$13:$I$13)
Choose
=CHOOSE(G15,"First","Second","Third")
Tables
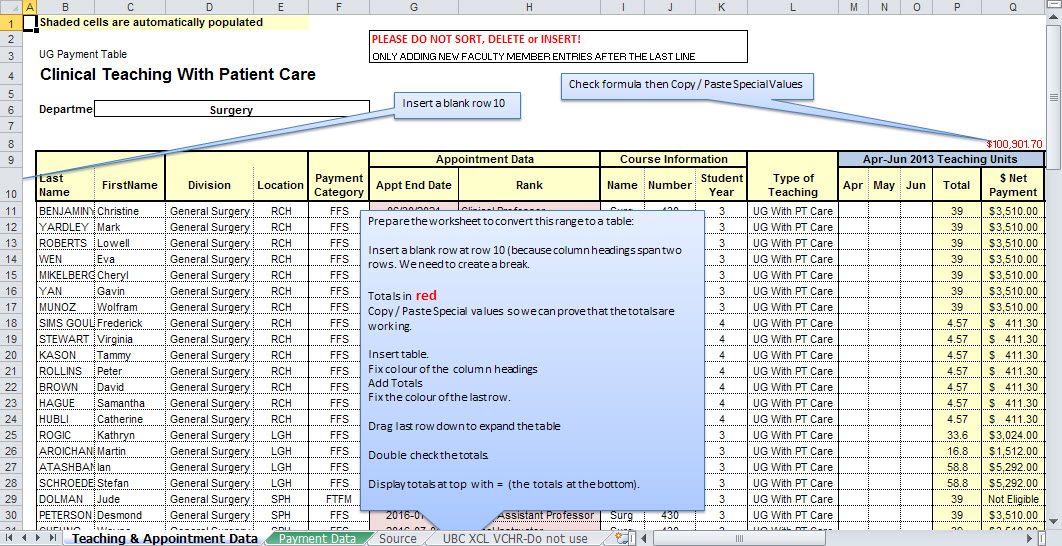
There are many built-in features that you can apply when you convert a range into a Table. Select a single cell in the range you want to convert, then choose the Insert Tab, then click the Table command.
In the example below we will convert an existing table (with a lot of formatting), so we will have to do some work before hand to make things work better. If there were no formatting and all the column headings were in a single row, we wouldn’t have to do any preparation.
References
- Create or delete an Excel table
- Add or remove table rows and columns in an Excel table
- Excel Table or Range – which is better?
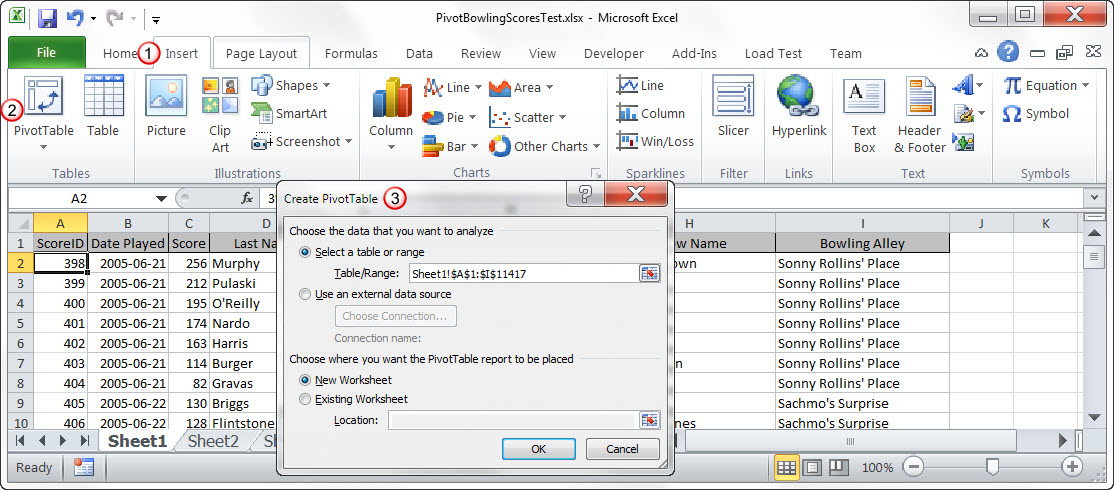
PivotTables
Here is a quick video of creating a PivotTable based on this file:
File: PivotBowlingScores.xlsx
Start with a range or table that has unique column headings in a single row at the top
The PivotTable opens in a new worksheet
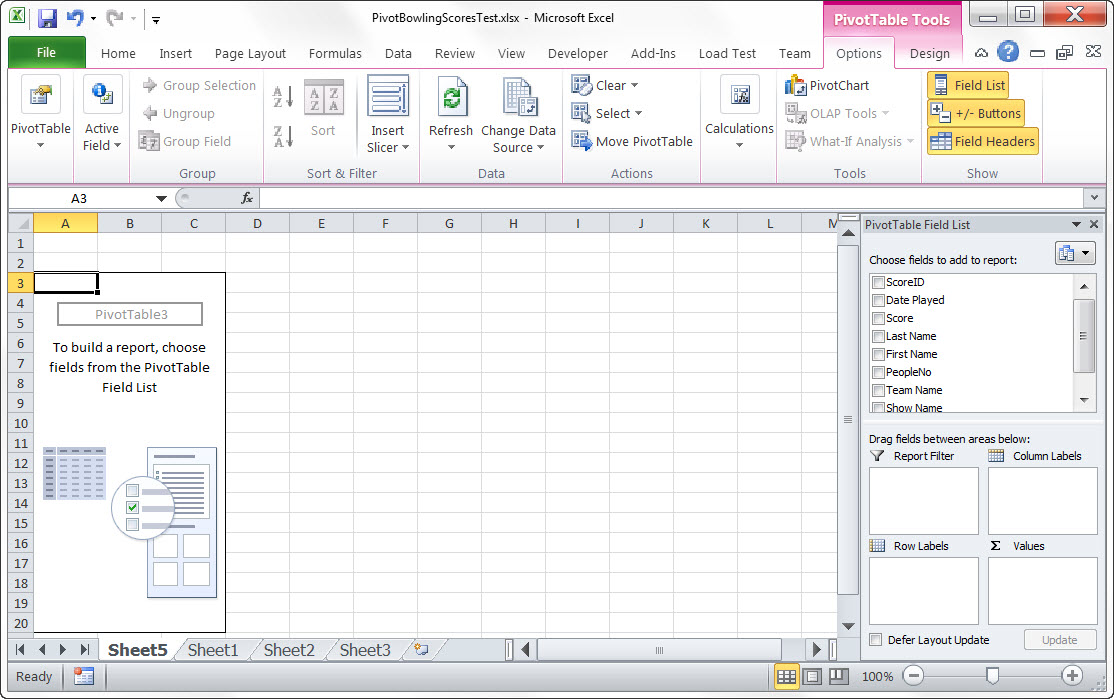
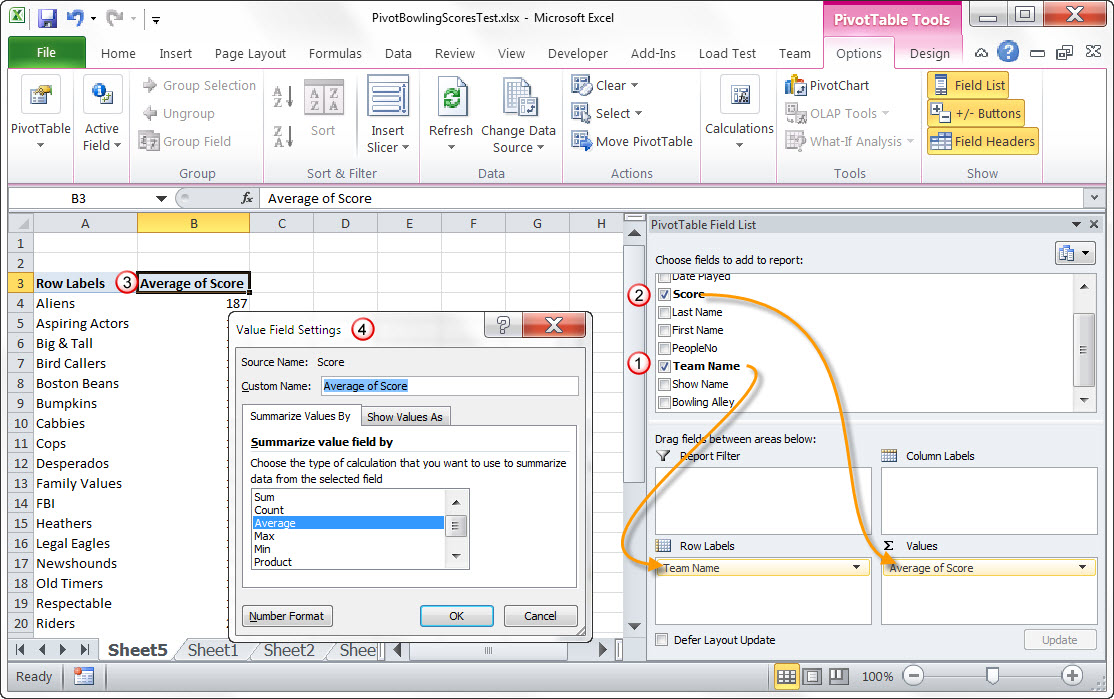
Click Fields (right side of the screen) from the field list for Row Labels and Values
Double click any summary number to see a new sheet with the drill-down details
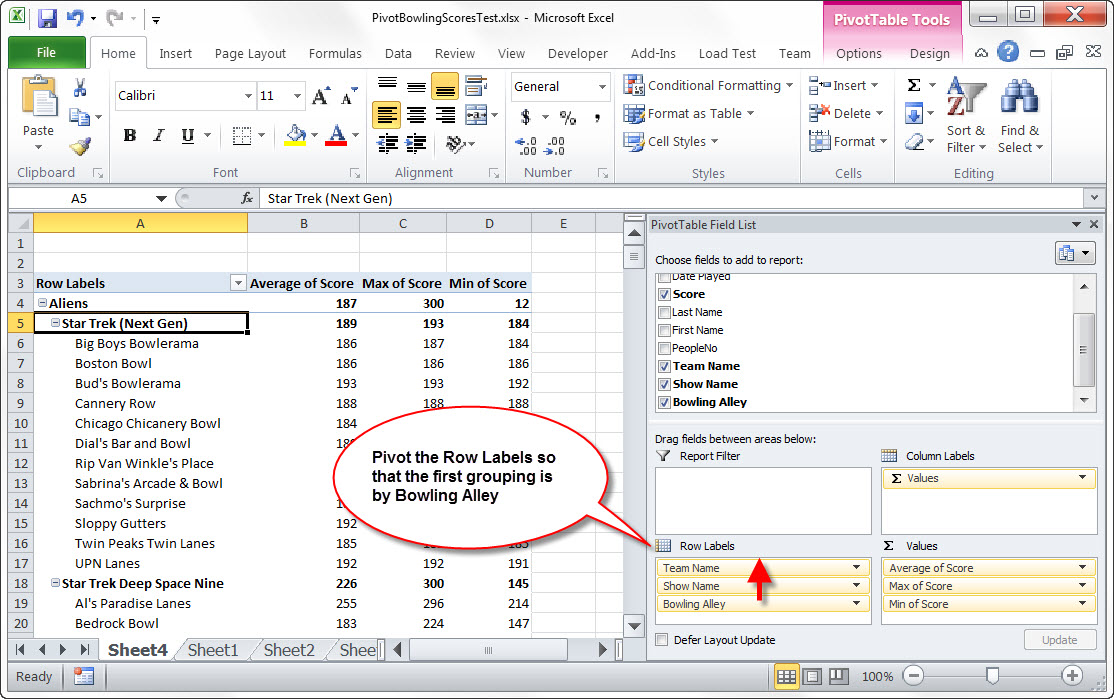
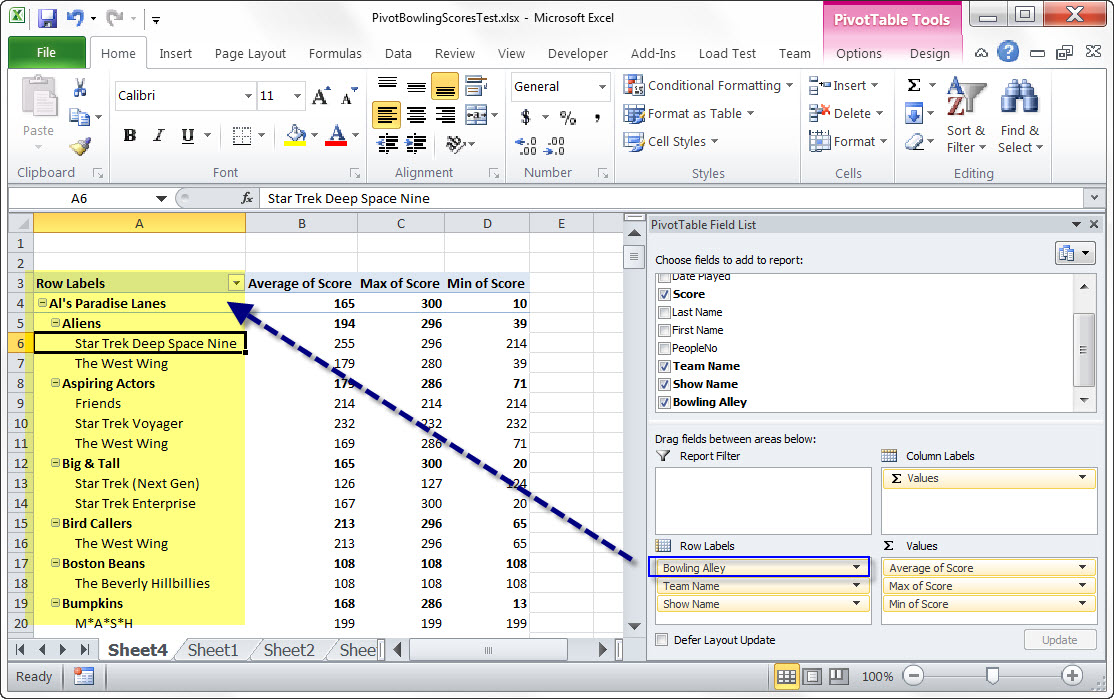
Try setting a Field as a Column Label
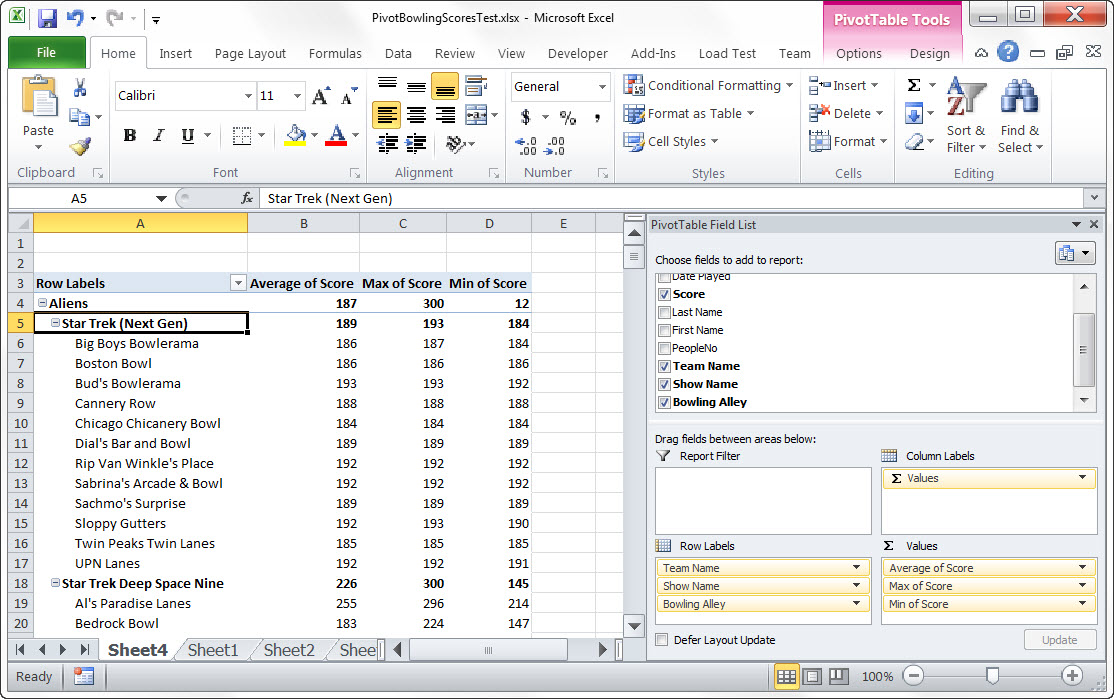
Try rearranging the Row Labels and Column Labels
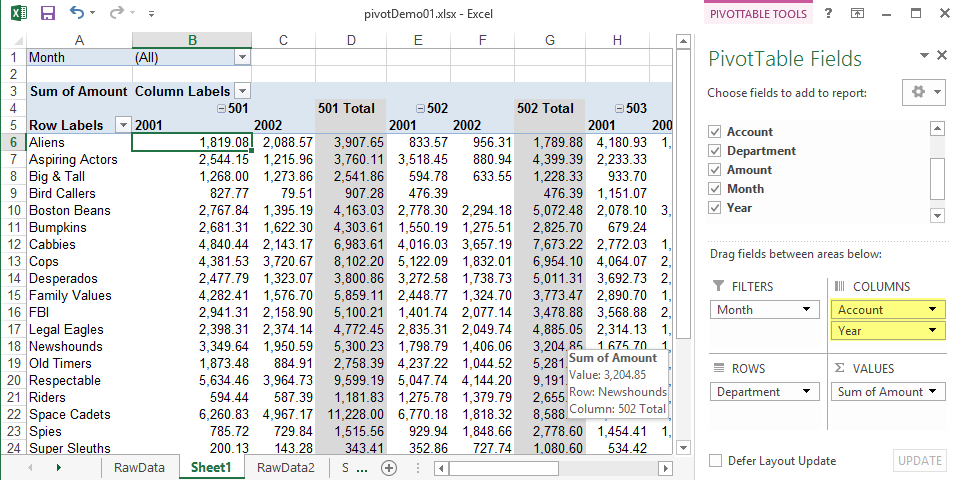
Pivot Chart Example

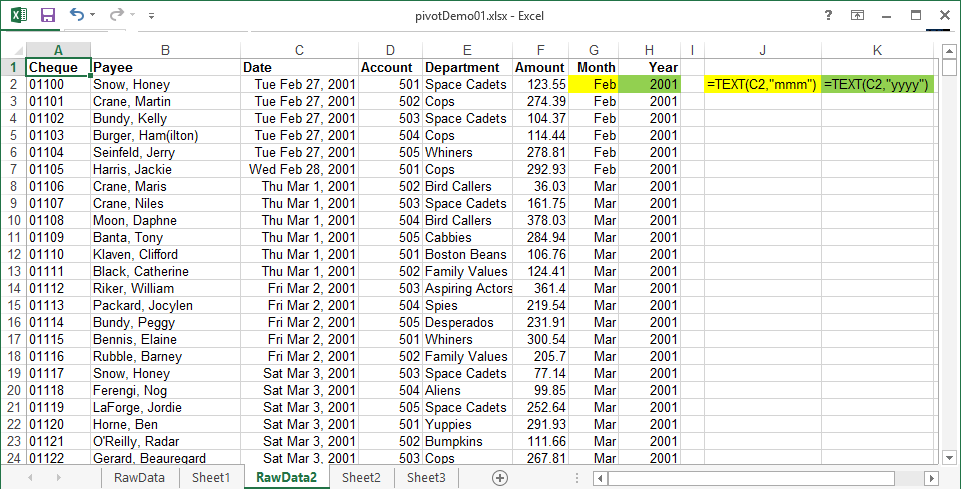
Pivot Cheque Register
Note: To make this example work, we need cells that contain Month and Year
G2:
=TEXT(C2,"mmm")

H2:
=TEXT(C2,"yyyy")
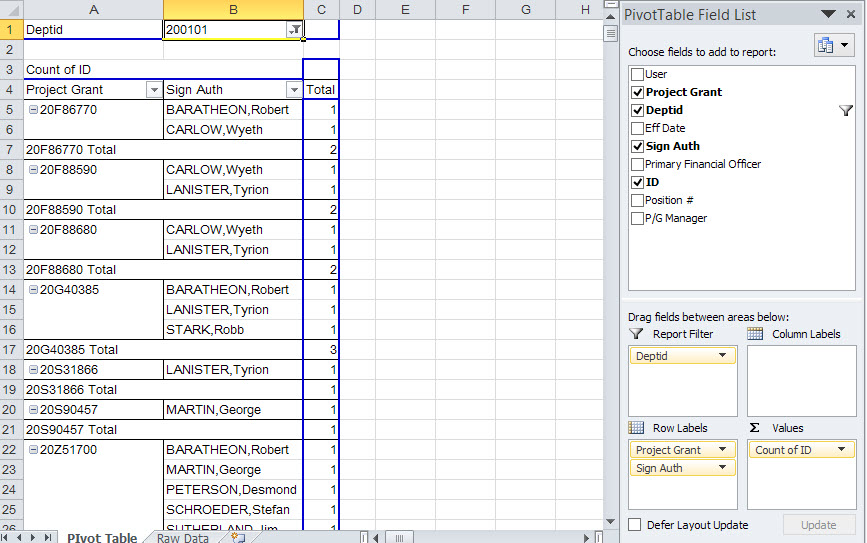
- Faculty of Medicine Examples
- Example 1 (counting instances) Raw Data
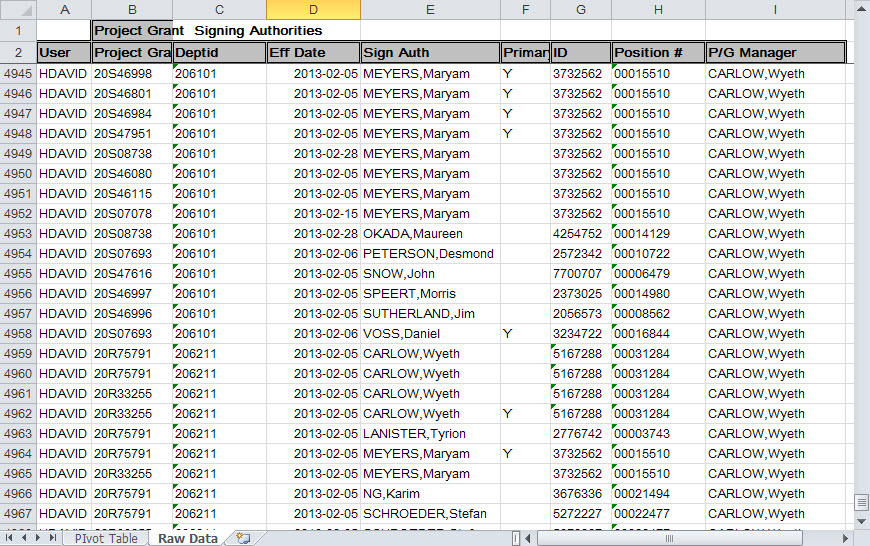
- Pivot Table
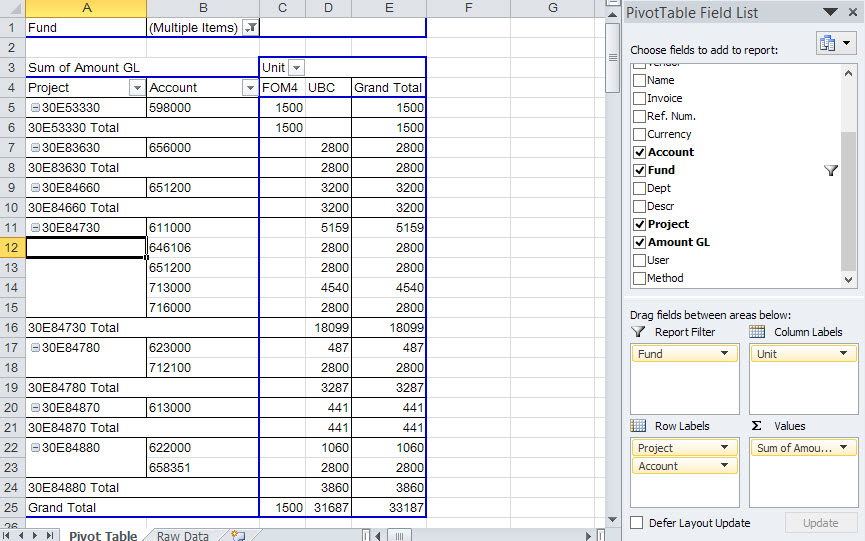
- Example 2 (money) Raw Data
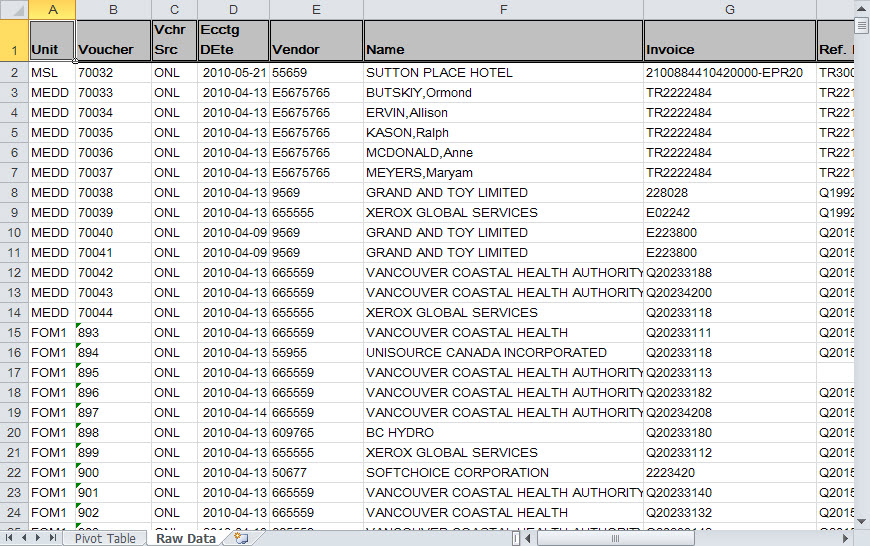
- Pivot Table
Link to this Table
Copy this link to your clipboard
https://fms-nquery.finance.ubc.ca/oldstuff/IHRIS/Departmentcodes.htm
In Excel – choose the Data Tab and Import from Web, then paste the link in to the box.
Or
- Follow the link above
- Right Click within the table of data
- Click Export to Excel
Resources
- What’s New in Excel 2013 | What’s New in Excel 2013 Word document 25 pages
- What’s New in Excel 2010
- Discontinued features and modified functionality in Excel 2010
- Microsoft Excel: Quick tips and tricks
- Use sparklines to show data trends
- Keyboard Shortcuts in Excel 2010
- Keyboard Shortcuts in Excel 2013
- Office Excel 2010 Charts And Graphs
- How to create a basic chart in Excel 2010
- The Office Show: Visualizing Data with Excel
- Table Improvements in Excel 2010
- What’s New in Excel 2010
- Changes in Excel 2010
- Excel Templates
- Up to Speed with Excel 2007
- Excel Ribbon Mapping Notebook Find old commands in Excel 2007
- Excel 2007 Quick Reference
- ASAP-Utilities free Add-ins for Excel. (Thanks Phil Carriere )